Probability
Introduction to Global Health Data Science
Goal
Goal of statistics
One goal of statistics is to answer a research question, by making inferences about a population based on data in one or more samples.
Population: the entire group we would like to make conclusions about (e.g., all people aged 15 and up in China, all pregnancies worldwide)
Sample: specific group we have collected data from (e.g., a random sample of non-institutionalized people aged 15 and up in sampled households, from sampled villages from sampled counties; pregnancies receiving prenatal care at Duke Hospital)
The validity of our inferences depends on a variety of factors, including the representativeness of our sample
Question: how representative of worldwide pregnancies would a sample from Duke Hospital be?
Wound treatment and care in termite-hunting ants
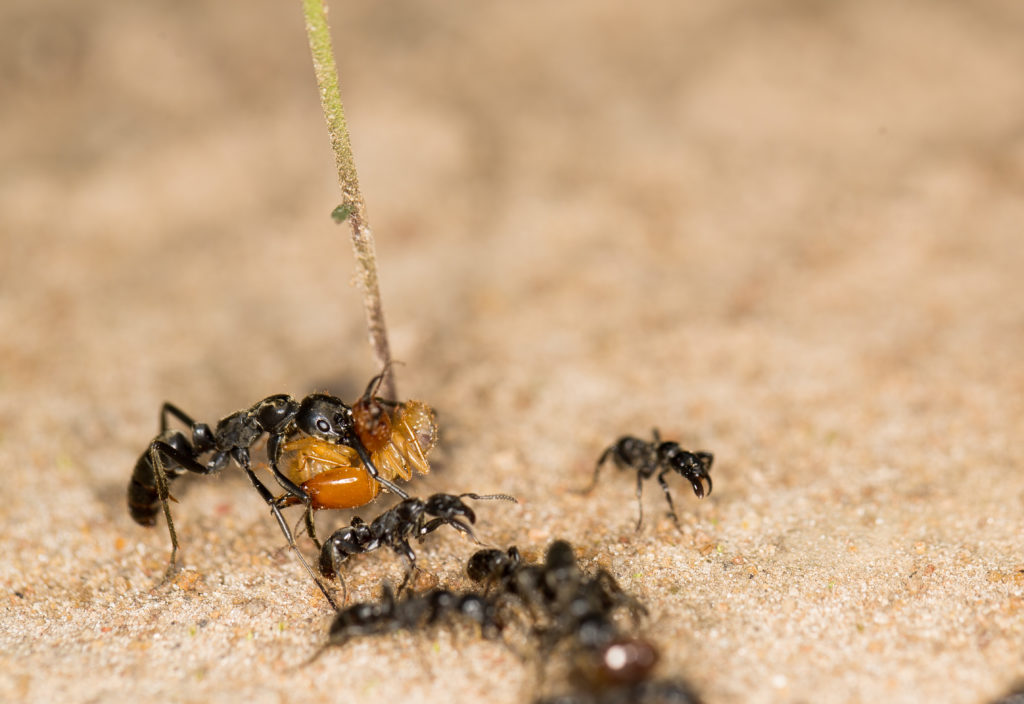
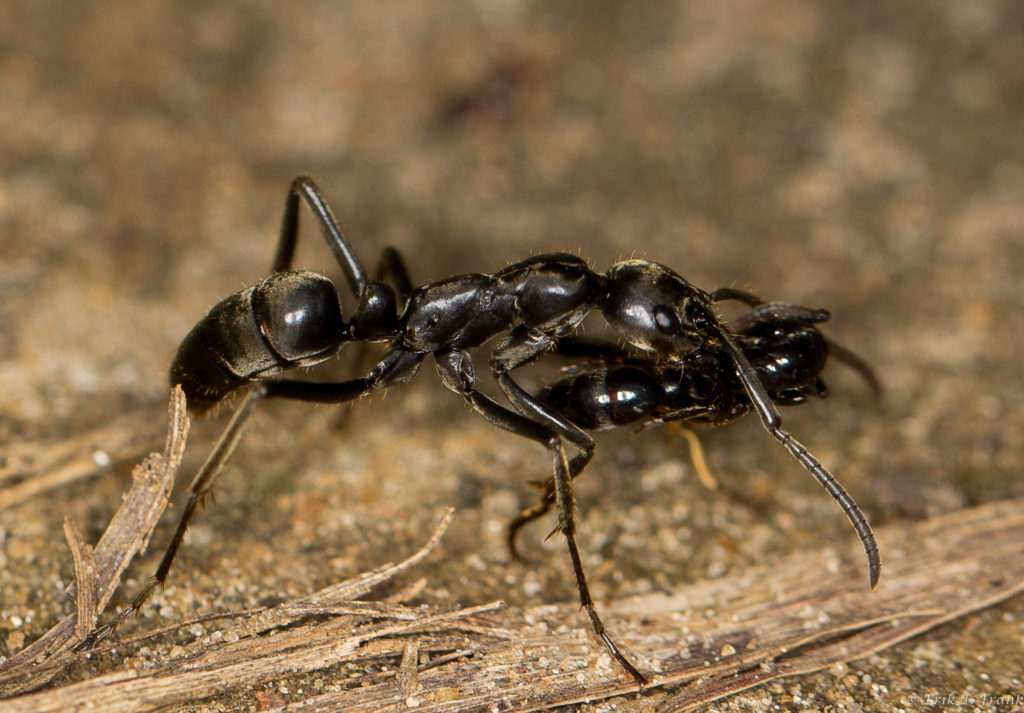
Erik Frank and colleagues have been studying the behavior of the termite-hunting ant species M. analis in the Ivory Coast. During termite raids, some ants are injured by the defensive actions of the termites, and these ants often receive medical aid from nest mates.
Frank’s team designed a series of experiments to explore factors related to different types of aid. How do ants decide which injured colleagues to treat?
Experimental design
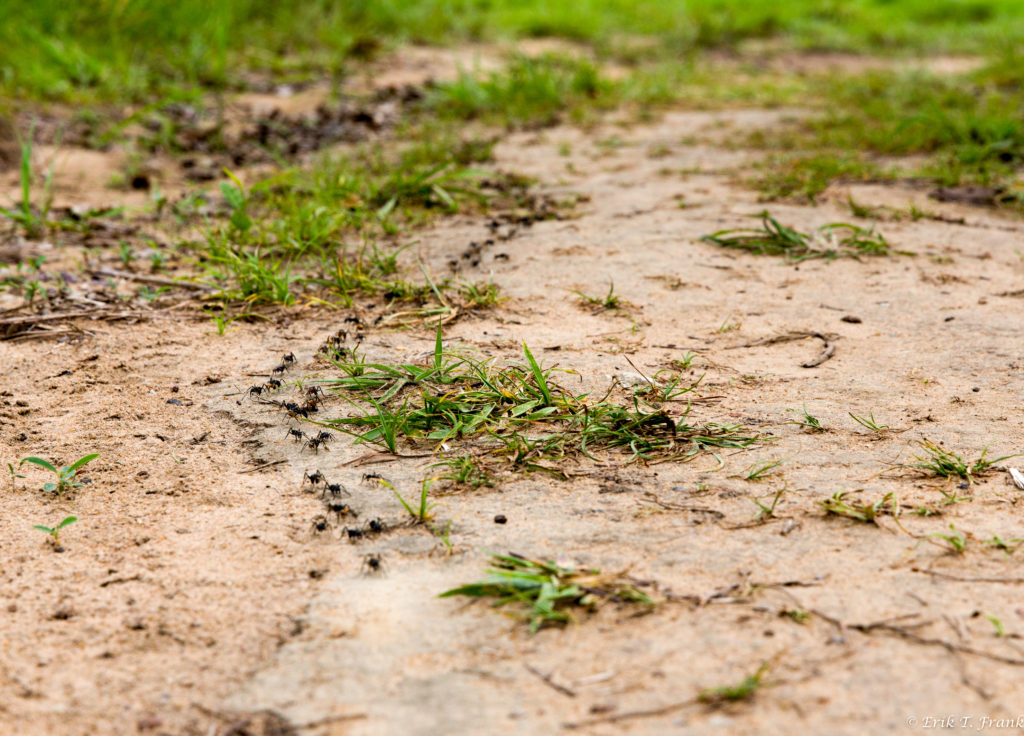
To test whether rescue behavior was directed primarily toward lightly injured rather than heavily injured ants, Frank and colleagues collected workers from groups departing on termite raids.
When the raiding column returned, they presented it with an injured ant positioned at the front of the returning column.
The injured ant had either:
- Light injuries: two legs removed with forceps
- Heavy injuries: five legs removed
Measuring rescue behavior
The researchers then observed how nest-mates responded to the injured ant.
They recorded several aspects of rescue behavior, including
- the duration of interactions with the injured ant, and
- whether the injured ant was carried back to the nest.
By comparing responses to lightly and heavily injured ants, they tested whether rescue behavior depended on the severity of the injury.
Drawing Conclusions
In order to draw principled conclusions from our data, we rely on a formal probabilistic framework that allows us to quantify uncertainty.
Statistical inference is built upon the foundation of probability theory.
Probability
The probability of an event tells us how likely an event is to occur, and it can take values from 0 to 1, inclusive. It can be viewed as the proportion of times the event would occur if it could be observed an infinite number of times. It can also be viewed as our degree of belief an event will happen.
Formalizing Probability
Events
An event is the basic element to which probability is applied, e.g. the result of an observation or experiment.
- A is the event that an ant is carried back to the nest
- B is the event that an ant is lightly injured
- C is the event that a person has blood type A+
Sample Spaces
A sample space is the set of all possible outcomes. So for example, the sample space could be all possible blood types, the event C is the event that your blood type is A+, and the rest of the sample space, \(\overline{C}\) as we will see in a minute, contains all other blood types.
The prevalence of blood types varies widely around the world. About 36% of the US population has blood type A+ (2nd most common type in US), and we say \(P(A+)=0.36\) in the US.
Sample spaces depend on the research question. For exploration of ABO blood types, the sample space is {A+, A-, B+, B-, AB+, AB-, O+, O-}.
Operations on Events
The union of A and B, denoted \(A \cup B\), is the event that A, or B, or both A and B, occur. Here, \(A \cup B\) is the event that an ant is carried back to the nest, lightly injured, or both.
The intersection of A and B, denoted \(A \cap B\), is the event that both A and B occur. Here \(A \cap B\) is the event that an ant is lightly injured and carried back to the nest. A and B are disjoint or mutually exclusive if \(A \cap B = \emptyset\) (A and B can’t occur simultaneously).
The complement of A, denoted \(A^c\) or \(\overline{A}\), is the event A does not occur (not carried back to the nest). \(A\) and \(\overline{A}\) are mutually exclusive.
How Do Probabilities Work?
Probability Rules
The probability of any event in the sample space is between 0 and 1, inclusive.
The probability of the entire sample space is 1.
If we know the probability of \(A\), often denoted \(P(A)\), it is easy to calculate the probability of \(\overline{A}\) as \(P(\overline{A})=1-P(A)\). This is called the complement rule: \(P(A)+P(\overline{A})=1\).
Additive rule of probability
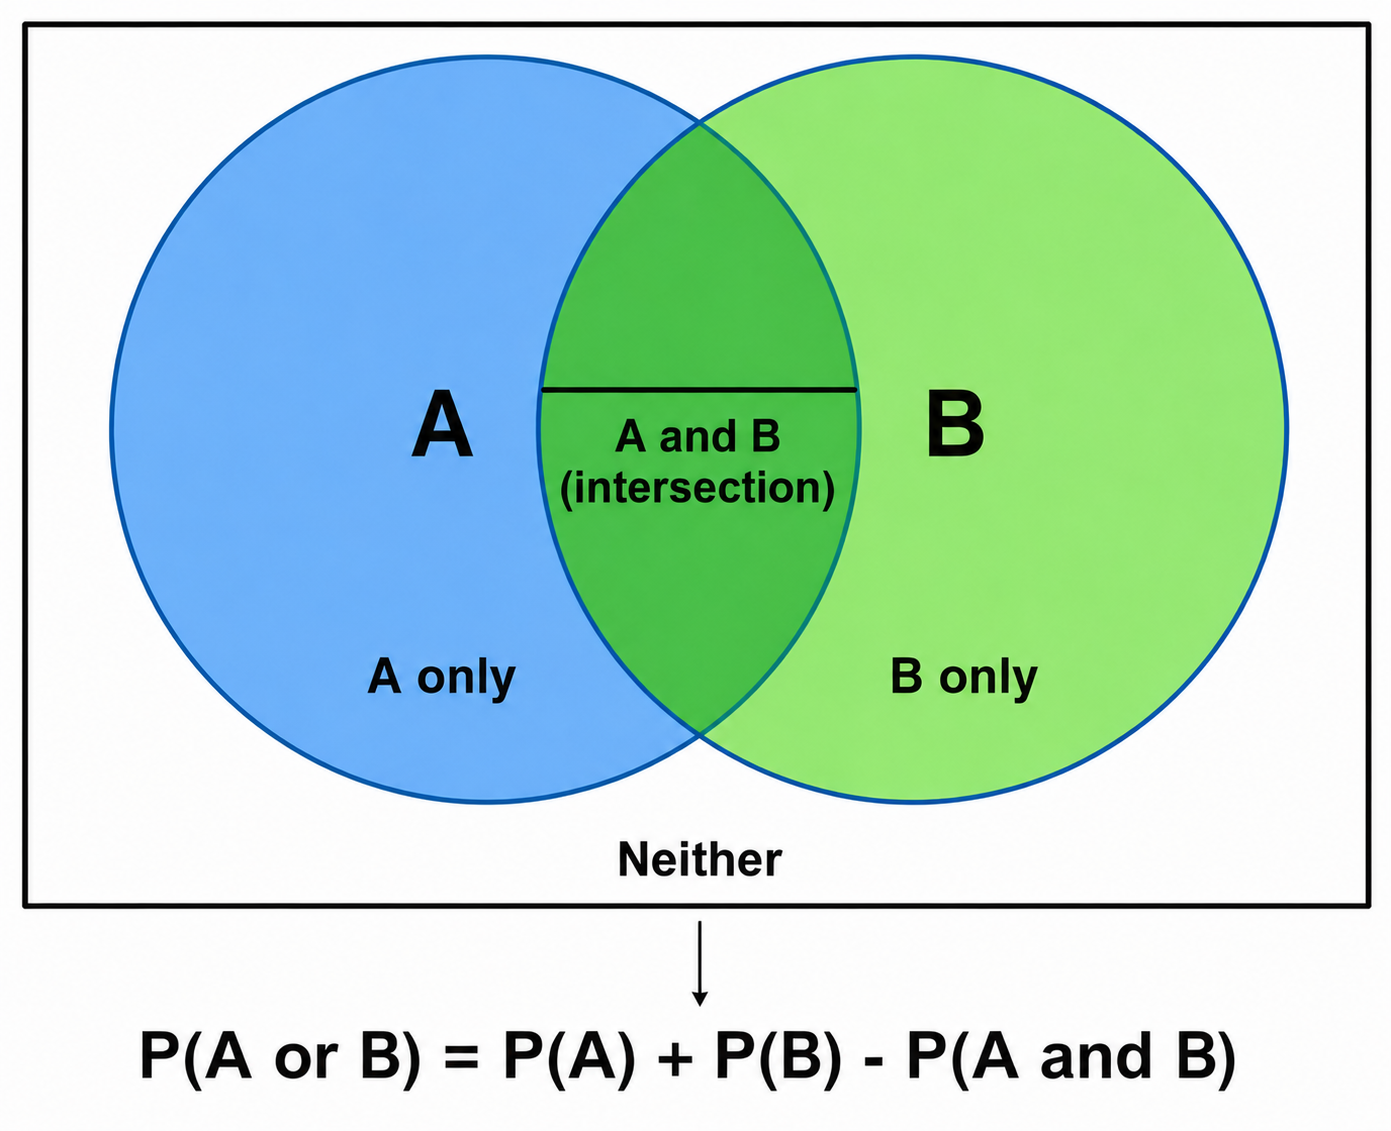
Because typically two events can occur simultaneously, we need to avoid double counting when calculating the probability that either of two events will occur.
The general additive rule of probability is
\[P(A \cup B) = P(A) + P(B) - P(A \cap B).\]
Because \(A \cap B\) is part of both event \(A\) and event \(B\), it would otherwise be counted twice.
If events \(A\) and \(B\) are mutually exclusive, then \(P(A \cap B)=0\), so the additive rule simplifies to \(P(A \cup B)=P(A)+P(B).\)
Computing Probabilities
Intuitively, we can think of the probability of an outcome (or set of outcomes) as the proportion of times the outcome (or set of outcomes) would occur if we observed the random process infinitely many times.
If all the outcomes in our random process (sample space \(\mathcal{S}\)) are equally likely, then for some event \(E\),
\[ P(E)= \frac{\mathrm{\#\ outcomes\ in\ }E} {\mathrm{\#\ total\ outcomes\ in\ }\mathcal{S}}. \]
Practice
Ant rescue behavior
Consider a subset of data from the ant experiment.
| Carried Back | Carried Away | Not Carried | |
|---|---|---|---|
| Lightly Injured | 45 | 0 | 5 |
| Heavily Injured | 5 | 5 | 20 |
You can think of “carried away” as a type of disposal.
Practicing with Probabilities
Define events A=carried back to the nest and B=lightly injured. Calculate the following probabilities for a randomly-selected injured ant from the study.
\(P(A)\)
\(P(\overline{A})\)
\(P(B)\)
\(P(\overline{B})\)
\(P(A \cup B)\)
\(P(A \cap B)\)
\(P(\overline{A} \cap B)\)
\(P(A \cap \overline{B})\)
\(P(\overline{A} \cap \overline{B})\)
What else might you want to know before you say something about the relationship between injury level and being carried back?
What makes us human?
Humans are not the only primates that experience insulin resistance.
Dwarf lemurs can experience reversible, seasonal insulin resistance as part of their natural response to hibernation.
In humans, persistent insulin resistance can increase the risk of developing type 2 diabetes.
Background: Blanco et al. (2023), Frontiers in Physiology
A comparative study
Suppose a hypothetical study includes 100 primates:
- 60 humans and 40 dwarf lemurs
- 30 show insulin resistance
- 18 are humans who show insulin resistance
Let H be the event a primate is human, and I be the event a primate shows insulin resistance.
(The data in this exercise are hypothetical.)
Your tasks
Use the information from the previous slide to:
- Construct a two-way table or Venn diagram.
- Calculate and interpret \(P(\overline{H})\)
- Calculate and interpret \(P(H \cap I)\)
- Calculate and interpret \(P(H \cup I)\)
- Calculate and interpret \(P(\overline{H} \cap I)\)
More practice
Pagano, Gauvreau, and Mattie
Section 5.6, problem 5